

Table of Contents
- What you need
- Read the four cards
- Read the monthly chart
- Download the PDF
- Read the weekly email
- When the numbers look wrong
- What this report is not
- Conclusion
A When Last Login User Statistics report is a summary of logins the free When Last Login plugin has already stored. The dashboard counts those logins for the date range you pick. A weekly email can send the same kind of summary to an inbox. This guide shows how to read both, and which numbers to leave on the sample screen.
It is not the Last Seen column on the Users screen. That column belongs to the free plugin, and How to Track a WordPress User’s Last Login is the guide for starting that record. It is also not When Last Login Pro. On 8 October 2026 the Pro page still says the plugin is coming soon and asks visitors to join a waiting list.
What you need
- The free When Last Login plugin. The WordPress.org listing checked on 8 October 2026 is version 1.2.4, updated 29 September 2026, tested up to WordPress 7.1.3, and it requires PHP 7.4. The User Statistics product page says the add-on needs When Last Login 0.7 or higher, so a current free install meets that line.
- When Last Login User Statistics, installed from your Yoohoo account. The same page lists 1 site at $47 a year, 5 sites at $97 a year, and unlimited sites at $147 a year, with a 14-day refund.
- Logins recorded after the free plugin was active. The report cannot invent visits from before that. The note on why Last Seen stays on Never describes the same limit.
The free plugin stores a login when WordPress runs the wp_login action after a successful sign-in. A custom form that never runs that hook can leave a person out of this report. If a known account is missing, sign in once through wp-login.php and look again.
Read the four cards
Open the screen titled User Statistics. The September 2026 dashboard screenshot below uses that title. The picture does not show the left-hand menu, so this guide does not guess a menu path.
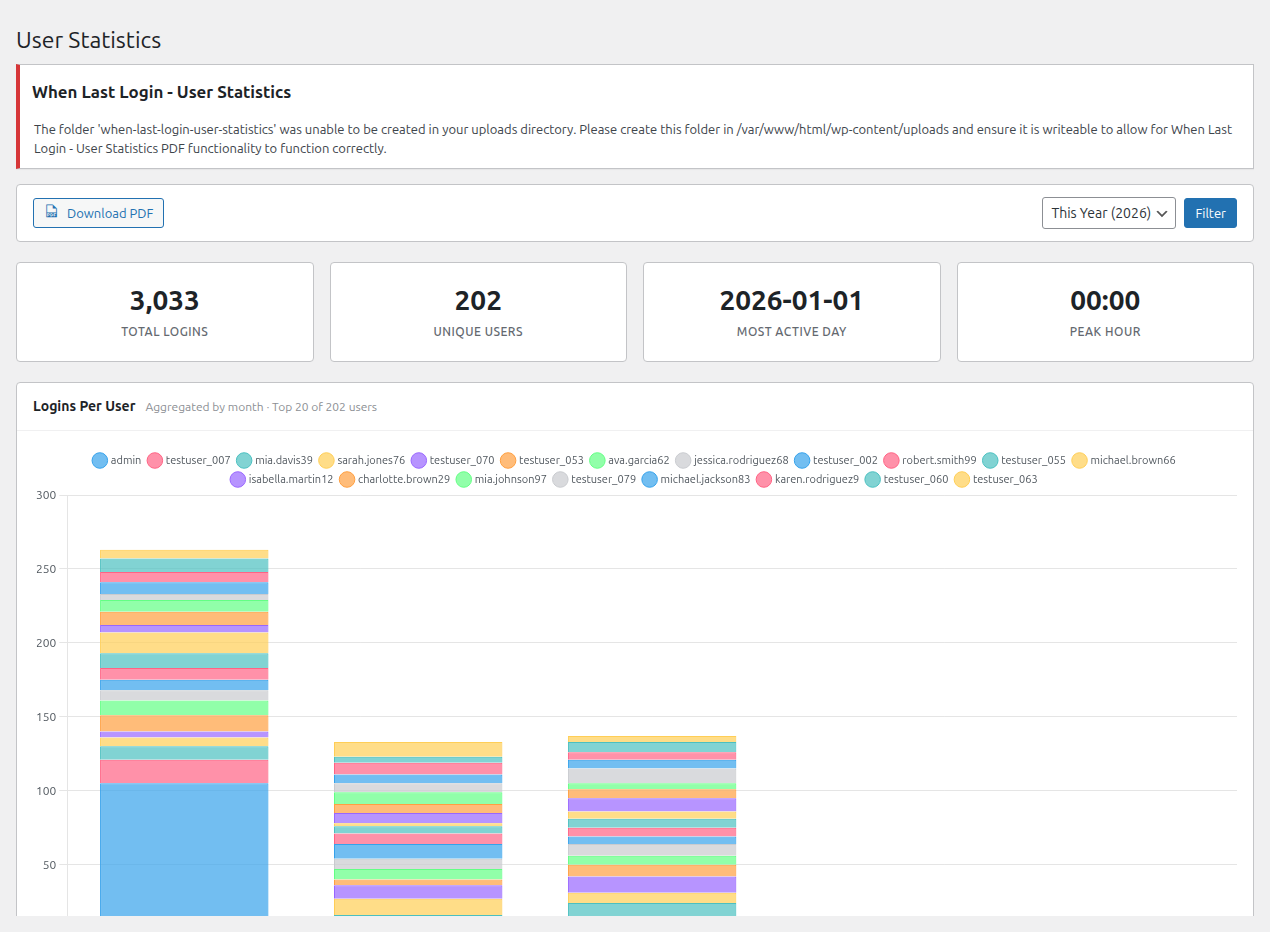
The range control in the picture is set to This Year (2026), with a Filter button beside it. The product page says the reports support custom date ranges. Change the range, then use Filter, before you read the cards. The four numbers belong to the range you filtered.
On that demo screen the cards read:
- Total logins: 3,033
- Unique users: 202
- Most active day: 2026-01-01
- Peak hour: 00:00
The chart legend includes accounts named testuser. Those figures are the demo. Do not expect the same day or the same hour on your site.
Total logins counts sign-ins. Unique users counts people. 3,033 logins from 202 users means the same people signed in more than once. A high total with a small unique count is repeat use. A unique count close to the total is mostly one login each.
Most active day is the date in that range with the most logins. Peak hour is the hour with the most logins. The chart under the cards is not the peak hour. It is a monthly view.
A peak hour of 00:00 on a wide range can be a real cluster, or it can be a thin range where one quiet hour still wins. Shorten the range and compare it with the daily table in the weekly email before you plan a launch around midnight.
Read the monthly chart
The chart on the same screenshot is labelled Logins Per User, Aggregated by month, Top 20 of 202 users. Each bar is a month. The colours split that month across the twenty busiest users in the range. A tall bar is a busy month for those users. It is not a busy hour, and it does not list everyone. The caption says the top 20 of 202.
The 2 April 2026 release note says this generation of charts uses Chart.js. That note is about the drawing library. It does not change how you read the month bars.
Download the PDF
The same screen has a Download PDF button. The product page lists PDF reports as part of the add-on.
The screenshot also shows a red admin notice. The folder when-last-login-user-statistics could not be created in the uploads directory, and the notice says PDF export needs that folder to exist and to be writable. The path printed on that server is /var/www/html/wp-content/uploads. Your host’s uploads path can be different. If you see the notice, create when-last-login-user-statistics inside your site’s uploads folder and make that folder writable. A screen without the notice does not need that repair.
The PDF is a copy of the report on screen for the range you filtered. It does not fill in the period before tracking started.
Read the weekly email
The 2 April 2026 release note says a weekly email goes out every Monday. The current product page says you can email reports on a schedule. This guide has not seen a control that moves the email to another weekday, so it does not tell you to change the day.
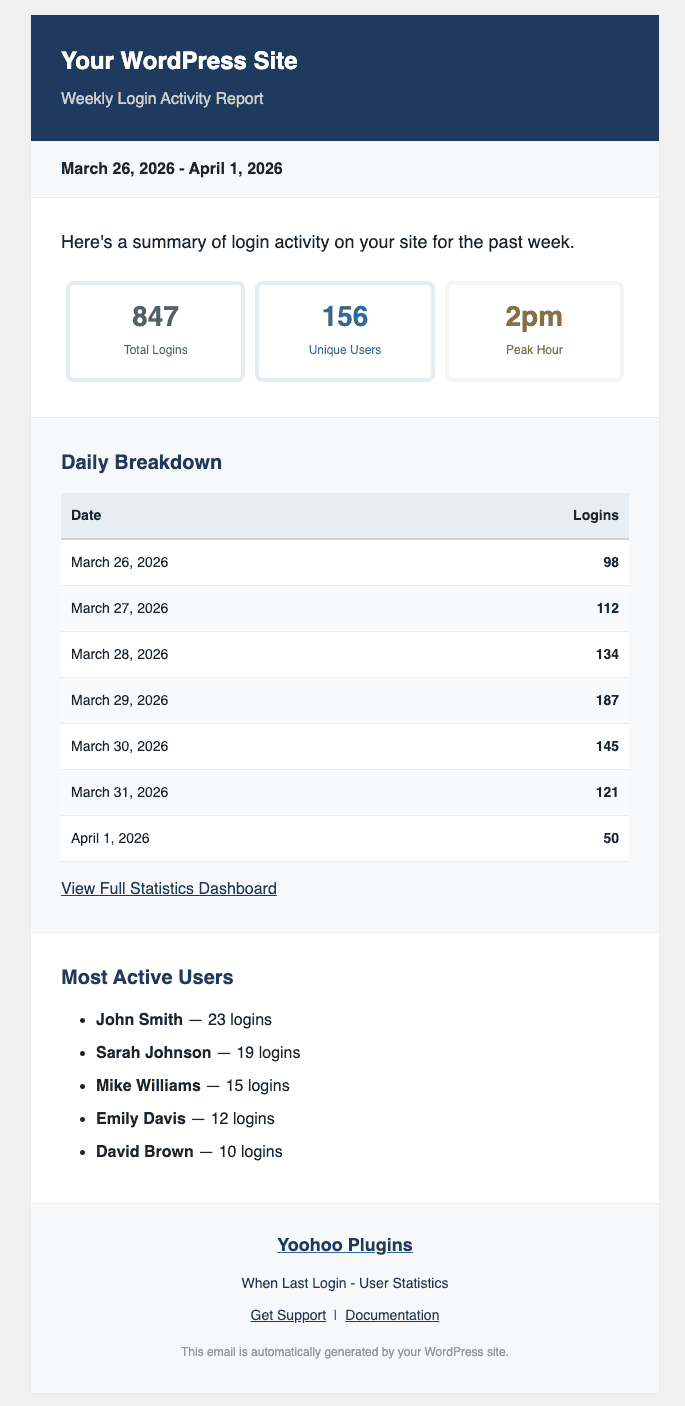
The sample is titled Weekly Login Activity Report. It uses the placeholder site name Your WordPress Site and the range 26 March 2026 to 1 April 2026. The visible blocks are:
- Total Logins, Unique Users, and Peak Hour
- A Daily Breakdown table, with a date and a login count on each row
- A link labelled View Full Statistics Dashboard
- Most Active Users, five names with a login count each
The names in that picture, from John Smith through David Brown, are the sample. They are not members of your site.
The release note also says the email includes a comparison with previous weeks. The captured sample shows the week’s totals, the daily table, and the five names. It does not show a previous-week comparison in that frame. Read a comparison when your own email includes one. Do not assume a trend the message in front of you does not print.
The email names people and counts their logins. That is personal data about who used the site. Send it only to people who already administer those accounts. The sample footer says the message is generated by your WordPress site.
When the numbers look wrong
- A new install can look empty until someone logs out and logs in again. An already-open session is not a new login. The statistics report can only count logins the free plugin stored.
- A login form in the theme or another plugin can skip
wp_login. If a person you just watched sign in is missing, test the same account onwp-login.php. If that login appears and the custom form does not, the form is the gap. The Never troubleshooting note walks through that test for the free plugin. - Unique users will usually sit below total logins. That is repeat visits, not a broken card.
- Most active day and peak hour follow the filter. This Year can crown 1 January or 00:00 when the rest of the year is sparse. Filter a shorter range before you treat one card as the audience’s habit.
- The top-20 chart hides quieter users on purpose. A person missing from the chart can still be inside the unique-users count.
What this report is not
The free plugin’s Users column and its All Login Records table are a per-person last login and a history list. This report is the totals, the day, the hour, and the monthly split.
The free Export User Records add-on downloads login records or user records as CSV or JSON. That file is a data export. It is not the User Statistics PDF and it is not the weekly email.
When Last Login Pro is a different product. Its page, checked on 8 October 2026, says coming soon. The pictures on that page are marketing cards, including a “Logins this week” chart and an Export CSV button. They are not the User Statistics screen in this guide. The Pro page points people who need a report now to User Statistics, and people who need a login ping now to Slack Notifications. Do not document Pro as if the plugin can be installed today.
Slack’s own active or away marker is a different question again. Does Slack Show Last Seen? covers that marker. A WordPress login alert in Slack does not tell you when someone was last seen inside Slack.
The product page also says a REST API can pull the stats into another tool. That page does not publish an endpoint list, so this guide does not invent one.
Conclusion
Read the filter first. Then read total logins against unique users, then the most active day and the peak hour, then the monthly bars or the email’s daily table. Keep the PDF and the weekly email for that same range, and keep the recipient list small.
When Last Login User Statistics is the report you can open today. If the site is not recording logins yet, start with the free plugin and the 8 September last-login guide.