

WP Better Reports is the Yoohoo plugin that puts visitor, login, and registration charts inside WordPress. The public product page is WP Better Reports. This how-to follows that page as it stood on 16 November 2026, including the six screenshots the page still shows.
The page does not publish a plugin version, and the public documentation index has no article for this plugin. The screenshots were uploaded in November 2019. One printed page carries the browser date 11/11/2019. Treat the numbers on them as that old Yoohoo site, captured for the product page, and still the pictures the page uses. Your own site will show your own counts.
This is a reading guide for those screens. It does not replace a settings manual the site does not publish, and it does not describe a menu name the screenshots never show.
What you need
You need a WordPress site where you can install plugins, and a copy of WP Better Reports from the purchase email or from File Downloads. The print header on the product page names the software WP Better Reports. This copy is not in the WordPress.org plugin directory, so Add New search will not find it.
The price line on the product page is 1 Site License at $47, 3 Site License at $97, and Unlimited Site License at $147. The same page says priority support and automatic updates last 12 months, and it shows a 14 day money back guarantee. It does not say the charge repeats every year, so this article does not call the price annual.
The page also does not state a WordPress, PHP, or WooCommerce minimum. This article does not invent one. A licence key for updates lives with the purchase, on License keys. The published screenshots do not show a licence box, so this article does not name a tab for it.
What the product page lists
The product page, download 5151, says the plugin tracks visitor views, the most popular pages, the most common login times, and registrations for a period. It also says anonymous user data is recorded, that a WooCommerce store can see its most popular products, that reports can be printed, and that color blind settings make the reports easier to read. It calls the plugin light, and it says documentation is available.
The six pictures on that page show three of those reports in detail: visitors, logins, and registrations, plus a popular-pages table and a printed copy of that table. Registration is shown twice, and the two full files are the same image. The pictures do not show a WooCommerce product table, a color blind control, or a documentation link that resolves to a guide. Later sections stay inside what those pictures and the page text actually show.
Install and find the cards
Upload the zip from File Downloads. WordPress explains that screen on the Plugins screen page: Plugins, Add New, Upload Plugin, then Install Now and Activate. Activate the plugin whose name matches the print header, WP Better Reports.
After activation, the product page never names the admin menu. Do not guess a path such as Dashboard, then a particular submenu. Look for the cards the screenshots use. Visitor Reports is one card. Login Reports is another. Registration Reports is a third. Each card in the captures has a View Details button.
The WordPress dashboard is the usual home for summary cards, and these screenshots look like dashboard cards, with a chart on the left and totals on the right. The captures crop the left admin menu, so the look is not proof of the menu label. If the cards are missing, confirm the plugin is active, then use the admin search or ask Yoohoo support rather than clicking through invented menus.
Read the visitor report
The Visitor Reports card is the wide chart. Its legend lists Unique Visitors, Page Views, Desktop Devices, and Mobile Devices. In the product-page capture the horizontal labels run 12, 13, 14, and on through 31, then 01 through 11. That is a set of calendar-day numbers crossing a month boundary. The vertical scale is marked up to 1500.
The totals beside the chart, in that same capture, are:
- Page Views 20237, Unique Visitors 8795
- Logged In 1020, Logged Out 19217
- Desktop 18382, Mobile 1855
- Popular Pages, Number 1 Home, Number 2 Archive Post
Logged In plus Logged Out equals 20237, the page-view total on this capture. Desktop plus Mobile equals that same 20237. Those two sums are a check on this picture. They are not a formula the product page writes down, and they are not a promise about every site.
A page view here is larger than a unique visitor: 20237 views and 8795 uniques in the sample. Logged-out views are the large share. Desktop is almost all of the device split, and mobile is 1855. Those ratios belong to the Yoohoo site in this old capture. A shop with a phone-heavy audience can look completely different. Read your own cards after the plugin has been collecting on your site.

The picture above is Media Library attachment 6123, the visitor example still on the product page. The alt text already on that file is “Visitor reports example”. Home and Archive Post are the sample site’s top two names, not placeholders you should expect on a new install.
Open popular pages
View Details on Popular Pages opens a table. The window title in the capture is WP Better Reports – Popular Pages. Two buttons sit by the title: Print and Close. A control at the top right reads 7 Days. The list under it says Show 10 entries, with a Search box, and the columns are Rank, Name, and Views. Names are links. The footer says Showing 1 to 10 of 80 entries, with pages 1 through 8.
The first ten rows in that 7-day capture are Home 1994, Archive Post 266, Increase WordPress Memory Limit 235, Programmatically Create A WordPress Post Or Page With PHP 184, Hide The WordPress Dashboard From Users 169, Archive Download 166, How To Change The Default From Email For WordPress 147, WP Zapier Integration 108, BLOG 103, and Setting Up A WordPress Child Theme 96. Those titles are pages on the Yoohoo site when the screenshot was made. Rank 1 in your table will be whatever your visitors opened.
The 7 Days label is the only range visible. The control is a dropdown, and the screenshot does not open it, so this article does not list the other ranges. Use the range the control shows, and read the footer count so you know whether ten rows are the whole result. Eighty entries means the later pages hold seventy more rows.
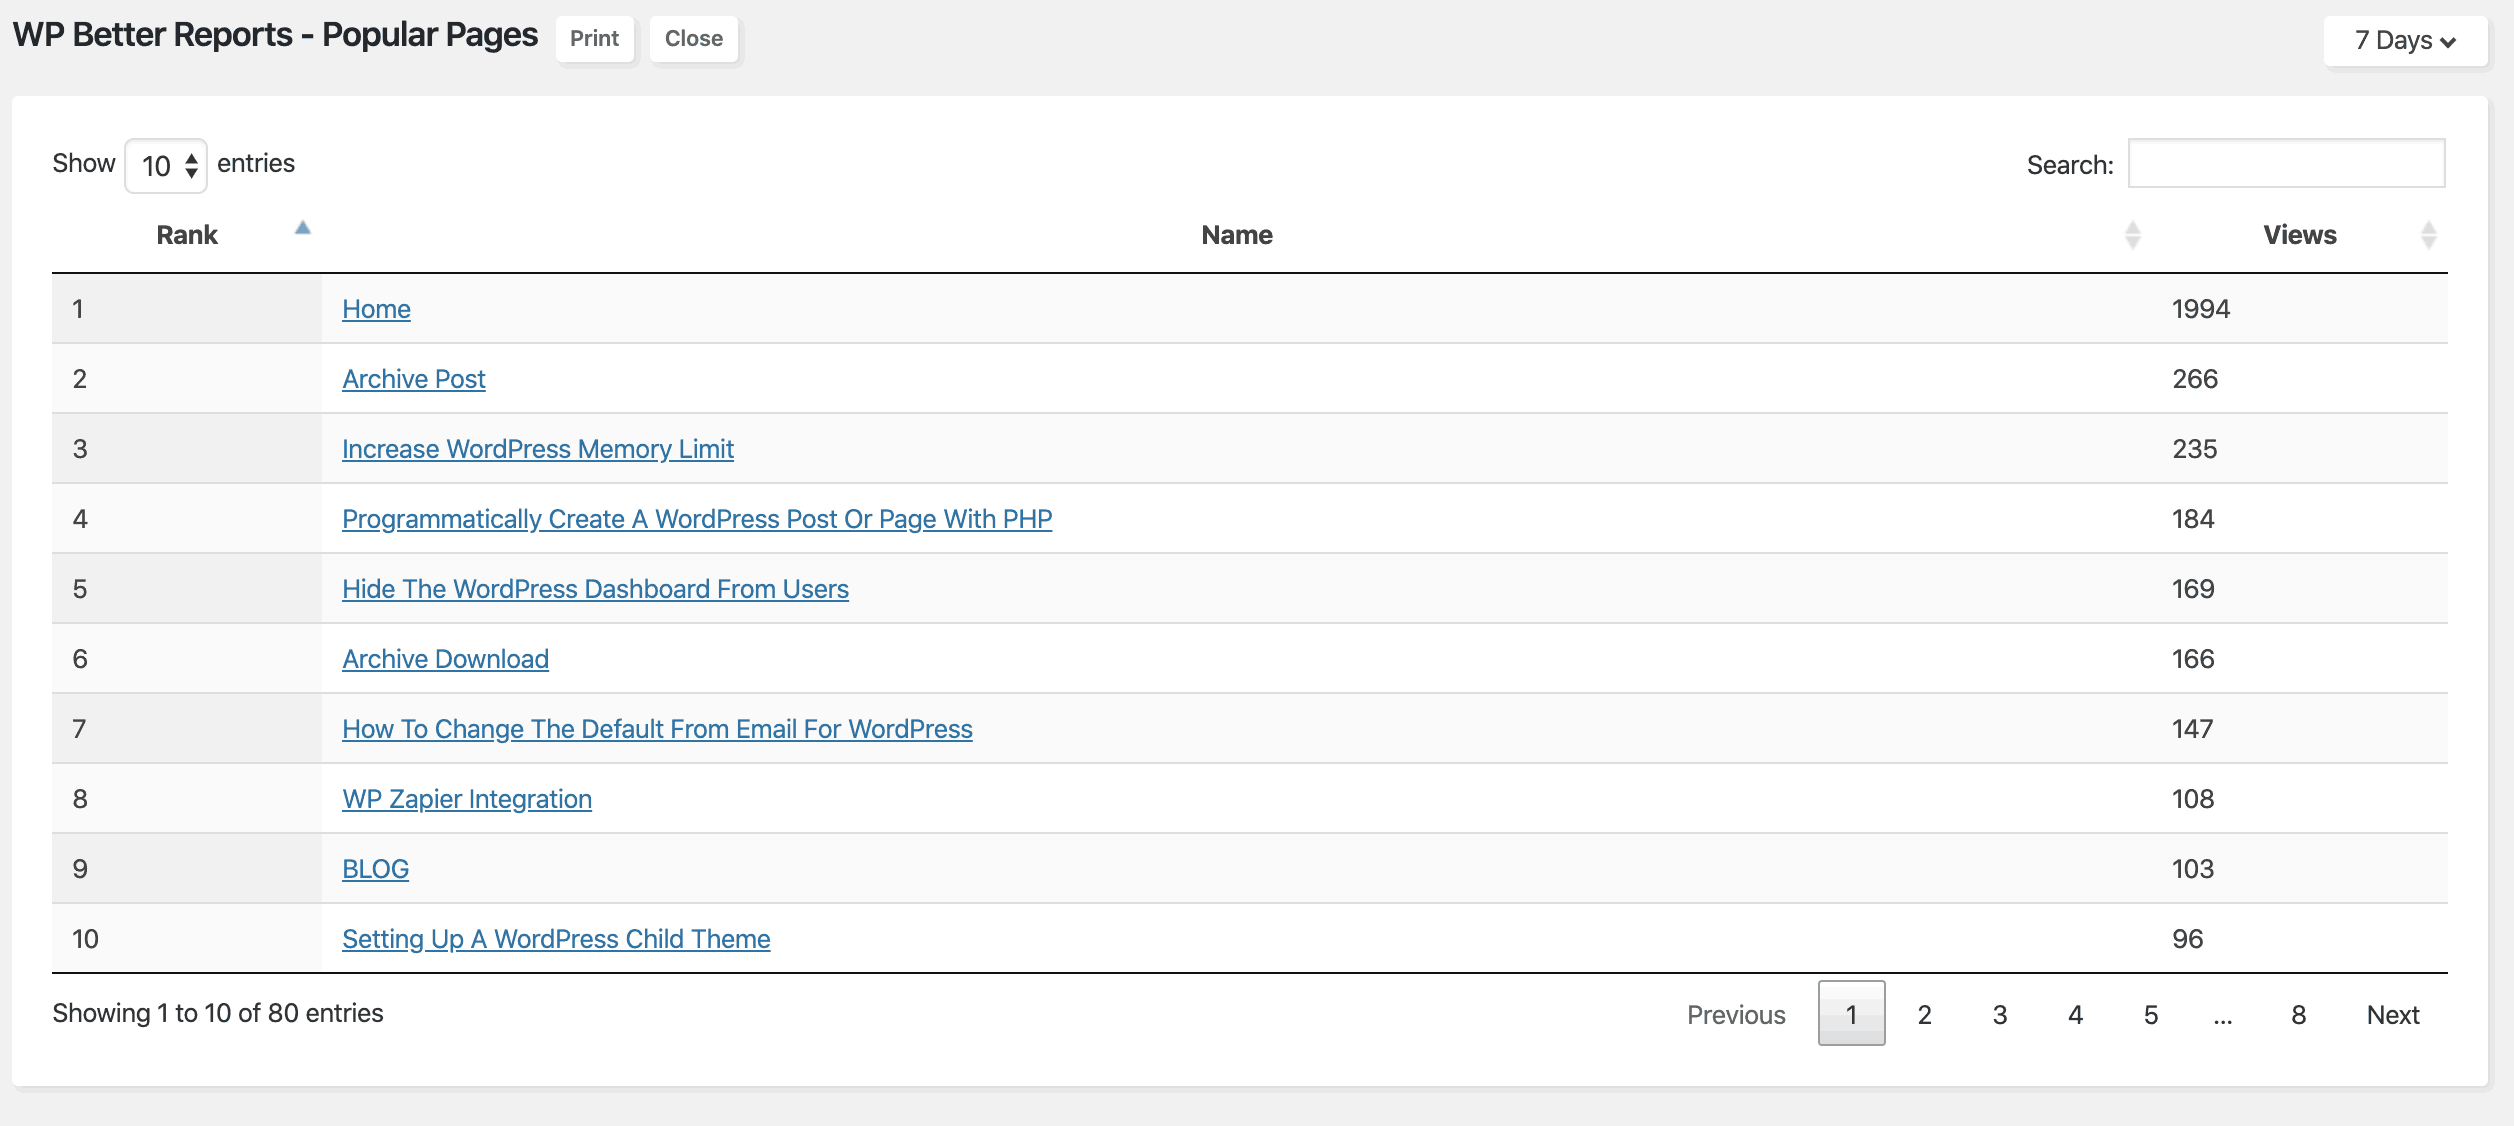
That table is attachment 6124. Its existing alt text is “Popular pages view details example”. Sort arrows sit on Rank, Name, and Views. Search filters the rows already loaded into the table. The capture does not show what happens when the search matches nothing, so try a word you can see, such as Home, and confirm the row remains.
Read the login report
The Login Reports card uses the same day-number axis, this time with a vertical scale of 0 to 6. In the capture the line touches 6 at the label 16, and it sits on 0 at several other labels. Beside it, Login Totals reads Today 1 and 30 Days 44. Popular Login Times reads Number 1 at 13:00 and Number 2 at 08:00. Most Active Users shows two counts, 17 and 2, each under a grey bar.
The file’s existing alt text says “Login reports example, usernames removed for security reasons.” The grey bars match that note: the names are not in the picture. Do not try to recover them from the bars. The counts 17 and 2 are what the capture leaves visible.
The clock times 13:00 and 08:00 have no timezone label on the card. Compare them with the timezone under Settings, then General, before you treat 13:00 as local afternoon. This article does not claim the plugin converts those hours. The administration screens guide is the map for that Settings screen. The 30 Days total is a label on the card. The chart’s day numbers run from 12 through 11, the same style of labels as the visitor chart. The picture does not print a sentence that says the line and the 30 Days box cover one identical range.

Attachment 6126 is that login card. Today 1 and 30 Days 44 are sample counts. A quiet site can show zeros. A zero in Today means the capture’s definition of today had no login, not that tracking is off. If 30 Days is also zero after a month of real logins, that is the moment to ask support, with the site timezone and a note of whether anyone has logged in.
Registrations and printing
Registration Reports is the third card. In the capture the line runs from the label 04 to the label 11, on a scale of 0 to 1. Registration Totals reads Today 1 and 7 Days 4. The product page shows this card twice, as attachments 6122 and 6125. The two full-size files are the same image, so this article describes the card once and does not repeat the picture.
A registration total is new accounts in the labeled window, as far as the card titles go. The picture does not show a list of those accounts, their roles, or the form that created them. Use the Users screen when you need the people. Use this card when you need the count.
Printing starts from the Print button on the details window. The product page also includes a printed page, attachment 6121, with the existing alt text “Example of Reports print page for WP Better Reports”. The browser header on that print reads 11/11/2019 and “WP Better Reports ‹ Yoohoo Plugins — WordPress”. The table columns are Rank, Name, and Views. Row 1 is Home at 1994, the same first row as the popular-pages table. The visible print continues through rank 26. It is a browser print of the page list, not a PDF invoice and not a file the plugin is shown saving to disk.
Click Print, then use the browser’s print dialog if you want paper or a PDF from the browser itself. Close returns from the details window. The capture does not show a separate export to CSV.
What these screens leave out
The product page says anonymous user data is recorded. The visitor card shows a Logged Out count, 19217 in the sample, next to Logged In. That is the on-screen split. The page does not say whether an IP address, a cookie, or a browser string is stored, and none of the screenshots show a retention setting. Describe what your site collects on the Privacy settings screen, in your own privacy policy. Do not copy the sample counts into that policy.
The product page says the plugin integrates with WooCommerce to show the most popular products. None of the six screenshots is a product table. There is no product name, no units sold, and no revenue figure in those pictures. Until a current screen shows that table, do not promise a merchandising report from this plugin in a client email.
The product page lists color blind settings. None of the six screenshots shows that control, so this article does not name a checkbox or a palette. If a reader needs a higher-contrast view, ask support to point at the control on the installed copy, and compare it with the cards above.
The product page says documentation is available. On 16 November 2026 a search of the public documentation index returned no WP Better Reports article. This post is the reading guide for the screens the product page already publishes. It is not a hidden settings reference.
There is also no version number on the product page, on the print header, or in the screenshot filenames. Leave the version out of the post, the excerpt, and any reply that points people at this article.
A different login report
Login counts on this card are not the same thing as a per-user last-login column. How to Read a When Last Login User Statistics Report documents a different plugin and a different screen: totals, a peak hour, a PDF, and a scheduled email for When Last Login User Statistics. WP Better Reports, in the pictures above, shows a login line, two popular clock times, and active-user counts with the names removed. Use the statistics report when you need that add-on’s dashboard. Use the Login Reports card here when you want the chart from this product page. The two articles do not share a menu, and this post does not claim the plugins write to each other’s tables.
Put the cards to work
After the plugin is active, read three cards and one table. On Visitor Reports, note page views, unique visitors, the logged-in split, and the device split, and check whether the pairs add up the way they do in attachment 6123. On Popular Pages, open View Details, read the range printed on the control, and use Search before you decide a page is missing. On Login Reports, read Today, the longer total, and the two clock times, and remember the names were removed in the public example. On Registration Reports, read Today and the 7-day total.
The sample numbers in this guide are the November 2019 product-page captures, confirmed still on the page on 16 November 2026. Your counts start from your own traffic. When a card disagrees with the Users screen or with the page you can see in a browser, write down the card title, the range label, and the site timezone, and send that to support with the product page open so both sides are looking at the same screens.